About Wix Table
In General
The Table element can be used to display data connected directly to a dataset or data set manually by writing code. This is not an element where you can manually type in data (like the Wix TableMaster widget allows you to do). Overall, you are able to design the look and feel, but it has limitations and results that are less than intuitive. You can add a Table element to:
dynamic pages
regular pages
inside of repeaters
Desktop version
Like mostly all the other Wix elements found in the editor, you will find you have more customization tools via the Desktop version of the Table element. You are able to customize the text, colors and general look and feel of the entire table as a whole. You cannot customize an individual column title. For example, you cannot have column 1 title to be a different color than the rest of the column titles. You also cannot have the background of column 1 to be different than the rest of the column backgrounds. (More about layout settings later.)
Mobile version
While the desktop version of a Table element allows you the flexibility to use the entire space between the grid lines, the mobile version is a bit more restricting. It is not very mobile friendly, as you cannot edit the text size, color or other design settings on the mobile version. You can only change the column width. Ultimately, this means you will end up with scroll bars and possibly disproportionate text size, header and row heights.

Good to Know #1
How to install and connect a Table
To begin using the Table element, you can add it from the Wix editor under 'Lists & Grids'.
(Note: Wix regularly and randomly decides to reorganize their elements so try to use the 'search function' at the top of the blue menu that you see in the image below if you cannot find the Table element. If you do not have this search function yet --- it is coming soon to an editor near you.)
You can select whichever pre-designed table you like the best. Either way, you can update the design as desired.

You can easily connect a table using a dataset. Or if you are more advanced, you can connect a table by writing some code. See Corvid Reference.
Connecting Table to a Dataset
As soon as you connect the Table element to the dataset of your choice, you will notice that the table automatically refreshes to display different columns. These columns represent a field in your database collection. Some fields may not be compatible, therefore they will not be displayed on the Table. Other fields do not automatically appear.
You can add columns as needed by clicking on the 'add column' button located in the 'connect table' panel.

From here, you will see a list of fields that have & have not been used in your Table element. Please be aware that the list may appear in a very small window --- you will have scroll VERY SLOWLY in order to view each of your options. It is easier to use the arrow keys on your keyboard to browse through the list because your mouse might cause the list to move too fast. (Typing on the keyboard does not work for 'searching' through this list.)

Within this list, you will only be able to select compatible fields. For example, you cannot select a Tags field (see image above) because it is not compatible for a Table element. You CAN, however, connect most Reference fields!
You can also delete columns as needed. Click on 'manage table' then hover over the column that you no longer want to display, and click 'delete' under the three dots.

Under the 'manage table' section you can also:
rename the column label that appears on the connected Table element
rearrange the order of the columns by dragging and dropping them


If you are wondering what the 'manage connections' button does. It just takes you back to the 'connections' panel so you can add more columns, if needed. So you add columns:
using the 'manage connections' button
using the database icon

Connecting Table Cell to a URL link
If you would like for users to click on a Cell to be redirected somewhere else, you must configure several things on your Table element.
The first is to link the specific cell by:
opening the connection panel
then clicking the link icon next to the cell you would like to link
then scroll down to view the 'new option' right under that column setting
(you must remember to scroll down, because something it will not scroll for you)
then click on the 'not connected' dropdown to select a compatible field

You cannot connect to a 'general' link. You cannot select a page, anchor or another native link from here. The link you select must be an actual field within your database collection. You can also link to other URL fields within reference fields.
Good to Know #2
Table Layout vs Dataset Settings
It is important to understand all the possible combinations there are for the Table layout and the dataset settings. After all, the only way to display data on a Table element is by connecting via a dataset or manually coding the values so they are 'injected' into the Table, so we need to make sure the data appears as intended or as expected.
Column Width & Row Height
You can define the row height and column width via the Table Layout settings icon. If you are manually setting a row's data via code, then you can also set the column width via code but not the row height because it will automatically adjust according to the data you assigned it.
Automatic Table Height vs Manual Table Height
Regardless of which setting you select, the Table settings will always disregard the Dataset settings you have selected and the Layout settings are less than intuitive. For example, check out these scenarios:

Scenario A
Dataset Limit set to 2
Table Layout set to Manual
Pagination turned on with 4 rows per page
By selecting 'Manually' adjusts via the Table Layout settings icon, you are able to resize the table to whatever height you want. By turning on the native pagination settings, you must define the number of rows you want to 'manually' show. (More on pagination later)
What is not intuitive about these settings is that the table's height will remain exactly as it is and you will have to manually adjust it to display your rows. For example, even if you selected to show only '4 rows' at a time, the Table will not automatically resize itself to show these 4 rows. You have to manually adjust the height of the Table to make sure these 4 rows are visible the way you intend them to be.
By not adjusting the Table size properly will result in displaying a scroll bar. By elongating the table too much will result in a large white space after the 4 rows. A person's first intuition would be to: go back into the editor and adjust the height. This may work part of the time, but what if there is a record in the database collection that has more words or characters than another? What if the other records have less words or characters than another? This makes it impossible to guarantee that you will not see the scroll bar or white space in the future (as new records are added or edited in your database collection. This will make it less than aesthetically pleasing.


Did you notice that the Table is displaying the 4 rows we selected in the Table Layout settings instead of only displaying the 2 items selected in the Dataset settings? Why is this not intuitive and not expected?
Because the entire purpose of having a Table element on the page is to connected to data (either by Dataset, or manually via code). So if we are connecting the data via a Dataset, why have the option to limit items in the Dataset at all? It would be more intuitive if:
as soon as the Dataset was connected to the Table, a warning message would show up explaining that the item limits via the Dataset settings are no longer relevant or not compatible with the Table element
the Table element did not have the 'number of rows' to display setting after turning on pagination since we have already defined the 'number of items' to display via the Dataset settings.
In short: the Table Layout settings supersede the Dataset settings.

Scenario B
Dataset Limit set to 3
Table Layout set to Automatic
There is a similar result as Scenario A. The Table layout settings disregards the limit set in the Dataset, meaning if there were 50 records in the database, then all 50 records would appear on the Table. Because of this, the native pagination settings is not compatible with this particular Table layout setting. Therefore, we do NOT RECOMMEND using the Table element for database collections that have many records.

Good to Know #3
Filtering & Searching through Table elements
The first thing you must know about Table elements is that they do not function like most spreadsheets do. This means, you cannot click on a column Title and expect for it to natively sort the table based on the title you selected. Clicking a column Title is also not something that can be coded. (More on click events later.)
If you want a user to filter or sort through the data, you must use other elements (such as Text, Dropdowns, etc) in order to filter the data. Depending on what approach you take, you can use code to either query a database collection or filter the dataset connected to the table.
Good to Know #4
Pagination Settings vs Pagination Bar Element

As you may remember from the 'Table Height vs Dataset Settings' section above, to use the native pagination settings function on the Table element you must turn on the 'manual height' option via the layout settings. You can also set the pagination settings via code.
Unfortunately, the new Pagination bar element is NOT COMPATIBLE with the Table element at this time. You can attempt to connect the pagination bar element to the same dataset that is connected to the Table element, but it will not change the 'page' or the 'records' on the Table element. You will see a short 'flicker' instead. (See video below.)
Good to Know #5
Understanding the hierarchy of the onClick events
The onClick event handler performs an action when any part of the entire table is clicked. This means, if a person clicks on a row, a cell, a title or even a corner of the table --- this even will be triggered. It is unclear if the onClick event causes errors for the other type of click events available for Table elements.
The onRowSelect event is triggered when a row is selected. This is the even handler that you would use if you want to get ALL the row information or only information from individual cells.
In order for either of these methods to work, you must click on the Table settings and select either 'Rows' or 'Cells' accordingly. The problem is you can only select one, which means you can only run one type of onRowSelect event.
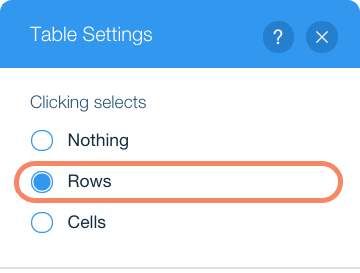
This means
If you select 'Rows' from the Table settings panel, the code will trigger the TableRowEvent and will allow you to get context, row data or row index for that specific row that was clicked. This will not tell which specific cell was clicked.
If you select 'Cells' from the Table settings panel, the code will trigger the TableCellEvent and will allow you to get things like: the column ID, data from the selected cell and the row index of the selected cell.
It also means you will have to decide which of the two Table settings would better suit your coding needs, since you cannot have both settings on the same Table at once.
Good to Know #6
Change individual cell color within a row
As of June 2020, this is not a functionality that is supported by the Wix Table element.
Alternate Solution
You can use a repeater element to create a 'table look a like'. Place elements within the repeater and design them to look like a list or table. You can use boxes and a little bit of code to 'hide' and 'show' the boxes based on the logic you have written for your code. (For example, you can write a code that is looking for a specific value in the repeater or write a code that is dependent on an action that happens on the page.)
Author
by Code Queen

Stuck on a project? Hire Code Queen, LLC!
Schedule a phone call or video call directly online. In a different time zone? No problem! Code Queen currently has clients around the world.
Online Booking: Discovery Session
Contact Form: Send project details
Thank you for sharing so detailed post!